I would have refused, on the basis that it is confusing and causes support questions, and not really meaningful in the context of an LFP battery. But that’s just me ![]()
Ok, but I still think that I am seeing wrong voltages and that the three display values do not really fit. Couldn’t that be true?
I have also disabled the calculations and readings in my system because I see the point much clearer in the cell voltages, but I can still see the midpoint stuff in my daughters system where I forgot to disable it.
I am on holidays now and therefore I have plenty of time to always look onto theses values :-))
EDIT: from PageBattery.qml:
			description: qsTr("Top section voltage")
			item {
				value: midVoltage.valid && dcVoltage.valid ? dcVoltage.value - midVoltage.value : undefined
				unit: "V"
				decimals: 2
			}
			show: midVoltage.valid
		}

		MbItemValue {
			description: qsTr("Bottom section voltage")
			item: midVoltage
			show: item.valid
		}
and this would be wrong. ‘Bottom section voltage’ should not show the midVoltage value.
I would never be so bold as to say the are no bugs ![]() So yes that could be possible.
So yes that could be possible.
The calcs are all in battery.get_midvoltage() which pass back the midpoint value and the deviation. The docs on what value is expected in /Dc/0/MidVoltageDeviation was a bit vague, so I had to play with the deviation calc until it looked like I expected the value to be.
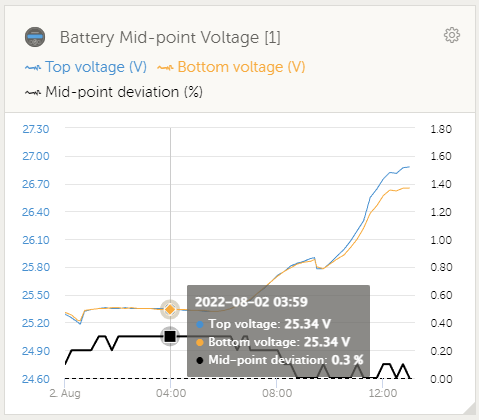
The calculation of the deviation in % seems correct. I think that the voltages shown are wrong (or at least do not fit to the text strings)!
This is what I mean, values do not match. Top and bottom voltages are equal and deviation is calculated as 0.3%.
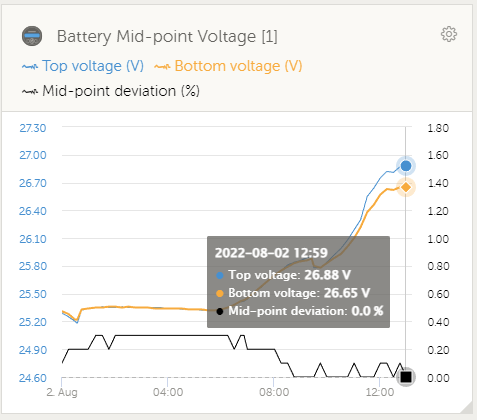
Then, Top and Bottom Voltages are different, but deviation is 0.0% (should be 0.9%!).
Is it ok to discuss this here ore should I open an issue?
BR, Jörg.
Discuss here is fine. We can open an ticket once something needs to change.
I could not find any reason on the deviation value as well. From what the driver sends to dbus I calculate the values that was sent to give 0 and 0.86% respectively. I’m not sure if anyone has some insight of where the graph get these values.
Victron calculate their LA with (Vtop-Vbot)/Vbat * 100 which give about half the values I have.
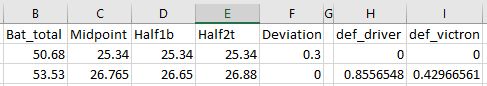
yes, I get the same values (0.86% rounded up to 0.9%).
I think the problem lies in the inconsistency of the data given to the system.
get_midvoltage() calculates the sum of the lower (let us say we have a 16 cell battery) 8 cells and the upper 8 cells. This gives the voltage of the whole battery (16 cells). From this sum of cells you calculate the midVoltage by dividing by 2. It is quite obvious that this is the correct value!
The ‘midvoltage deviation’ value is calculated correctly from these two sums of 8 cells! (or if it is half the value is a matter of definition … what you have calculated is the deviation between lower and upper half whereas Victron gives the deviation of the the measured midpoint to the theoretical, ideal midpoint. To be honest, I think that the Victron value is a bit more sensible regarding the name ‘midpoint deviation’ …)
But then:
The JK-BMS reports a ‘battery voltage’ that is from an additional, redundant measuring input!
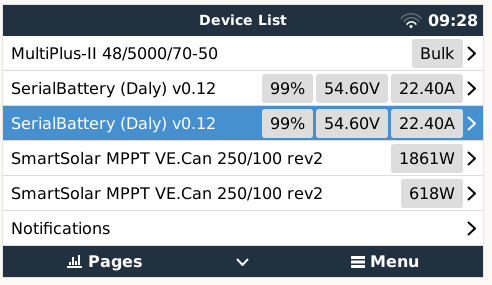
I have just made a screenshot of the JK-BMS app and added up all the values:
- sum of 16 cells: 53,795V
- battery voltage: 53,94V
get_midvoltage() returns the above mentioned (sum of 16 cells)/2 as the ‘midVoltage’ value which is then send to the Victron system. As I see from the pageBattery.qml this ‘midVoltage’ value is shown as the ‘bottom section voltage’, which is BS. Then, the ‘top section voltage’ is calculated as dcVoltage-midVoltage, which is even worse, as two different measuring values are combined (dcVoltage is the ‘battery voltage’ of 53,94V whereas the midvoltage is half of the sum of cells 53,795V/2).
(and normally, batteryVoltage-midVoltage=midvoltage!!! So top section voltage would always be the same as bottom voltage)
This cannot work.
Hmmm, is it possible to understand what I have written?
BR, Jörg.
Hi @Louisvdw I’m trying to implement your driver for the lowest cost battery here in Brazil.
Your code edited by me: LIFEPO04/lifepo04.py at main · stanhausc/LIFEPO04 · GitHub
The error I’m stuck on:
I tried using “h:short; H:unsigned short” but without success, the only way to connect was using “B:unsigned byte”.
unpack_from(“>BBBBBBBBBBBBBBBBBBBBBBBBBBBBBBBBBBBBBBBBBB”,
I think the error is due to this part of the code, could you clarify for me how exactly this works?
Thank you, and congratulations for your work.
This is another point that shows that the ‘midVoltage’ deviation stuff is more complicated to ‘simulate’ than thought (because there is no directly measurable ‘mid’-voltage with an odd number of cells).
With 15 cells it would perhaps be wiser to sum up the lower 8 cells and the upper 7 cells separately (or vice versa). And then divide the sum over all cells by 15 (to get the cell average) and multiply with 8. Then compare this voltage with the lower 8 cell sum and calculate the deviation in %. In this case all cells would be considered correctly. But of course this is no longer a ‘mid’-voltage anymore.
Not sure how work charging process but 99% should charge 5A, why does it not work?
My setting, charge curent 80A, 3.45V and 2.9V, Discharge 200A
You did not perhaps disable the CCCM in utils.py?
Hmm. So would you say the summ off all cells is less acurate than the full battery voltage. I would think they should be the same. It might be that some resistance/loss in the balance wires is giving the discrepancies perhaps?
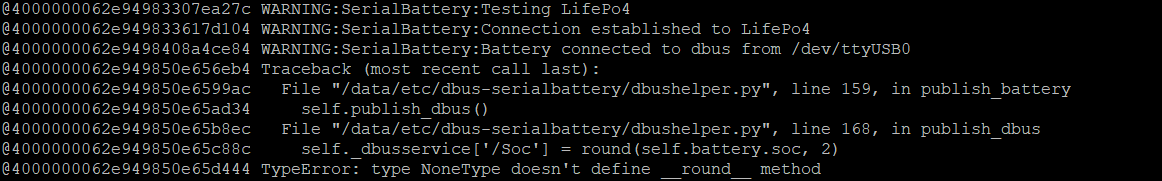
There are some values that have to be populated for each battery. Without those the battery does not have enough values to populate the system.
SOC, Voltage, Current and the amount of cells are the most important.
The error you get is saying that the SOC variable does not have a nummber value. If you don’t have the SOC from your battery yet and want to try the driver then just give it a starting value of 50 for now.
The unpack stuff is to extract the data bytes to the values your BMS returns. You need to patch that to the protocol of the battery that you are looking at. So some values will be 4 bytes large, some 8 bytes, some 1 byte and these need to match the value you are reading. If you are only reading B that means it is 1 byte for each variable which has a value range of 0-255 and I would guess that is not correct.
For instance for JBD BMS there is a
unpack_from(‘>HhHHHHhHHBBBBB’
which say we have many short (H) and unsigned short(h) 2byte integer values, followed by 5 1byte values.
See the python struct docs for the full list of options.
1 Like
Especially with the JK BMS I can see that the cell voltage readings are not extremely stable. They seem to ‘fluctuate’ by some mVs, perhaps even up to 10mV. And then the JK BMS seems to use an additional adc for reading the battery voltage. This reading is much more stable (seems to me at least).
The resistance of the balance wires do not normally influence the readings at all since balancing is switched off during adc sampling in nearly all ICs I know off. And I am not using the BMS balancing at all, too.
OT, but also JK BMS related: I quite often see that a current of -0.00A is shown and consequently also -0W. This is not nice, but due to the fact that the current reading has two values for zero current, 0 and 32768. Would be nice if the driver could ‘filter’ that out.
An idea, as I’ve seen it. After I re-crimped the balancing wire lug, it was sorted.
If I may? This discussion on Midpoint, which will be inaccurate, is for what purpose to fix, spend effort on?
Never used it for as I mentioned before, the Delta is a far better option to focus on when looking for a problem brewing.
Midpoint is only valid really for Lead Acid. I suggest its disabled for Lithium by default… Save a lot of hassle ![]()
No horse in this race, but if you were going to come up with some sort of “how balanced is this thing” number, a better option would be to stuff your cell voltage into some kind of statistical variance calculation. The delta between highest and lowest cell is a pretty good indicator, but it doesn’t tell you whether there is 1 low cell and 15 high ones, or 15 low cells and 1 high cell.
Standard deviation comes to mind, but that’s only half the answer.
In my opinion, if you had the min, max, mean and mode, that will tell you just about everything you need to know.
(The mode, in case you are as forgetful as me, is the one that occurs the most often, after sorting)
So if you binned them to the closest 0.01V or something, then you could get a picture like this:
min = 3.33V
mode = 3.35V
max = 3.55V
This tells you you have a high cell. Conversely…
min = 3.1V
mode = 3.45V
max = 3.52V
This tells you you have a low cell problem.
A a graph all those cells with the values would show you HOW BAD the problem cell was…
1 Like
In fact, continuing my thought in another reply…
How about you just log the median voltage (the cell in the middle) as the midpoint value. I would think that is actually useful in a statistical way, as it tells you something about the distribution.
If you have one low cell (3V), 14 moderately full cells (3.45V) and one high cell (3.5V), that tells you:
min = 3.0V
median = 3.45V
max = 3.5V
This tells you that the majority of the cells are likely on the higher side, since the median is much closer to the max.
Just an idea…
I do like the idea. The problem is that there are only 2 values that get published to dbus.
The midpoint and a deviation. The battery value is taken from the battery voltage that was published.
So not sure I will be able to map that to
min
median
max
Except if I missed something? We are still talking about the midpoint graph, yes?
I tend to agree that repurposing the midpoint graph (which really really is a lead acid thing and should never have been done in my opinion) as a median-cell-voltage value is a little naughty, and not backwards compatible.
I suppose I am just babbling, thinking out loud. The deviance could perhaps be repurposed a little more easily and less naughtily.
If all the cells are in perfect balance, then the standard deviation is 0.
>>> from statistics import stdev
>>> stdev([3.45]*16)
0.0
A slight variance, with a single outshooting cell, which is quite normal:
>>> stdev([3.55]+[3.45]*15)
0.02499999999999991
And when it gets worse…
>>> stdev([3.45]*14 + [3.1, 3.5])
0.08920949127381758
So a stdev of say 0.03 is then somewhat of a red flag. Just speculating.