Even on a bright sunny day and a constant load, why is pv production erratic, just wondering 
Hi Tariqe, can you please post a graph to show this behavior, i guess it might be related to the issue that was pointed out earlier this week by level3 support.
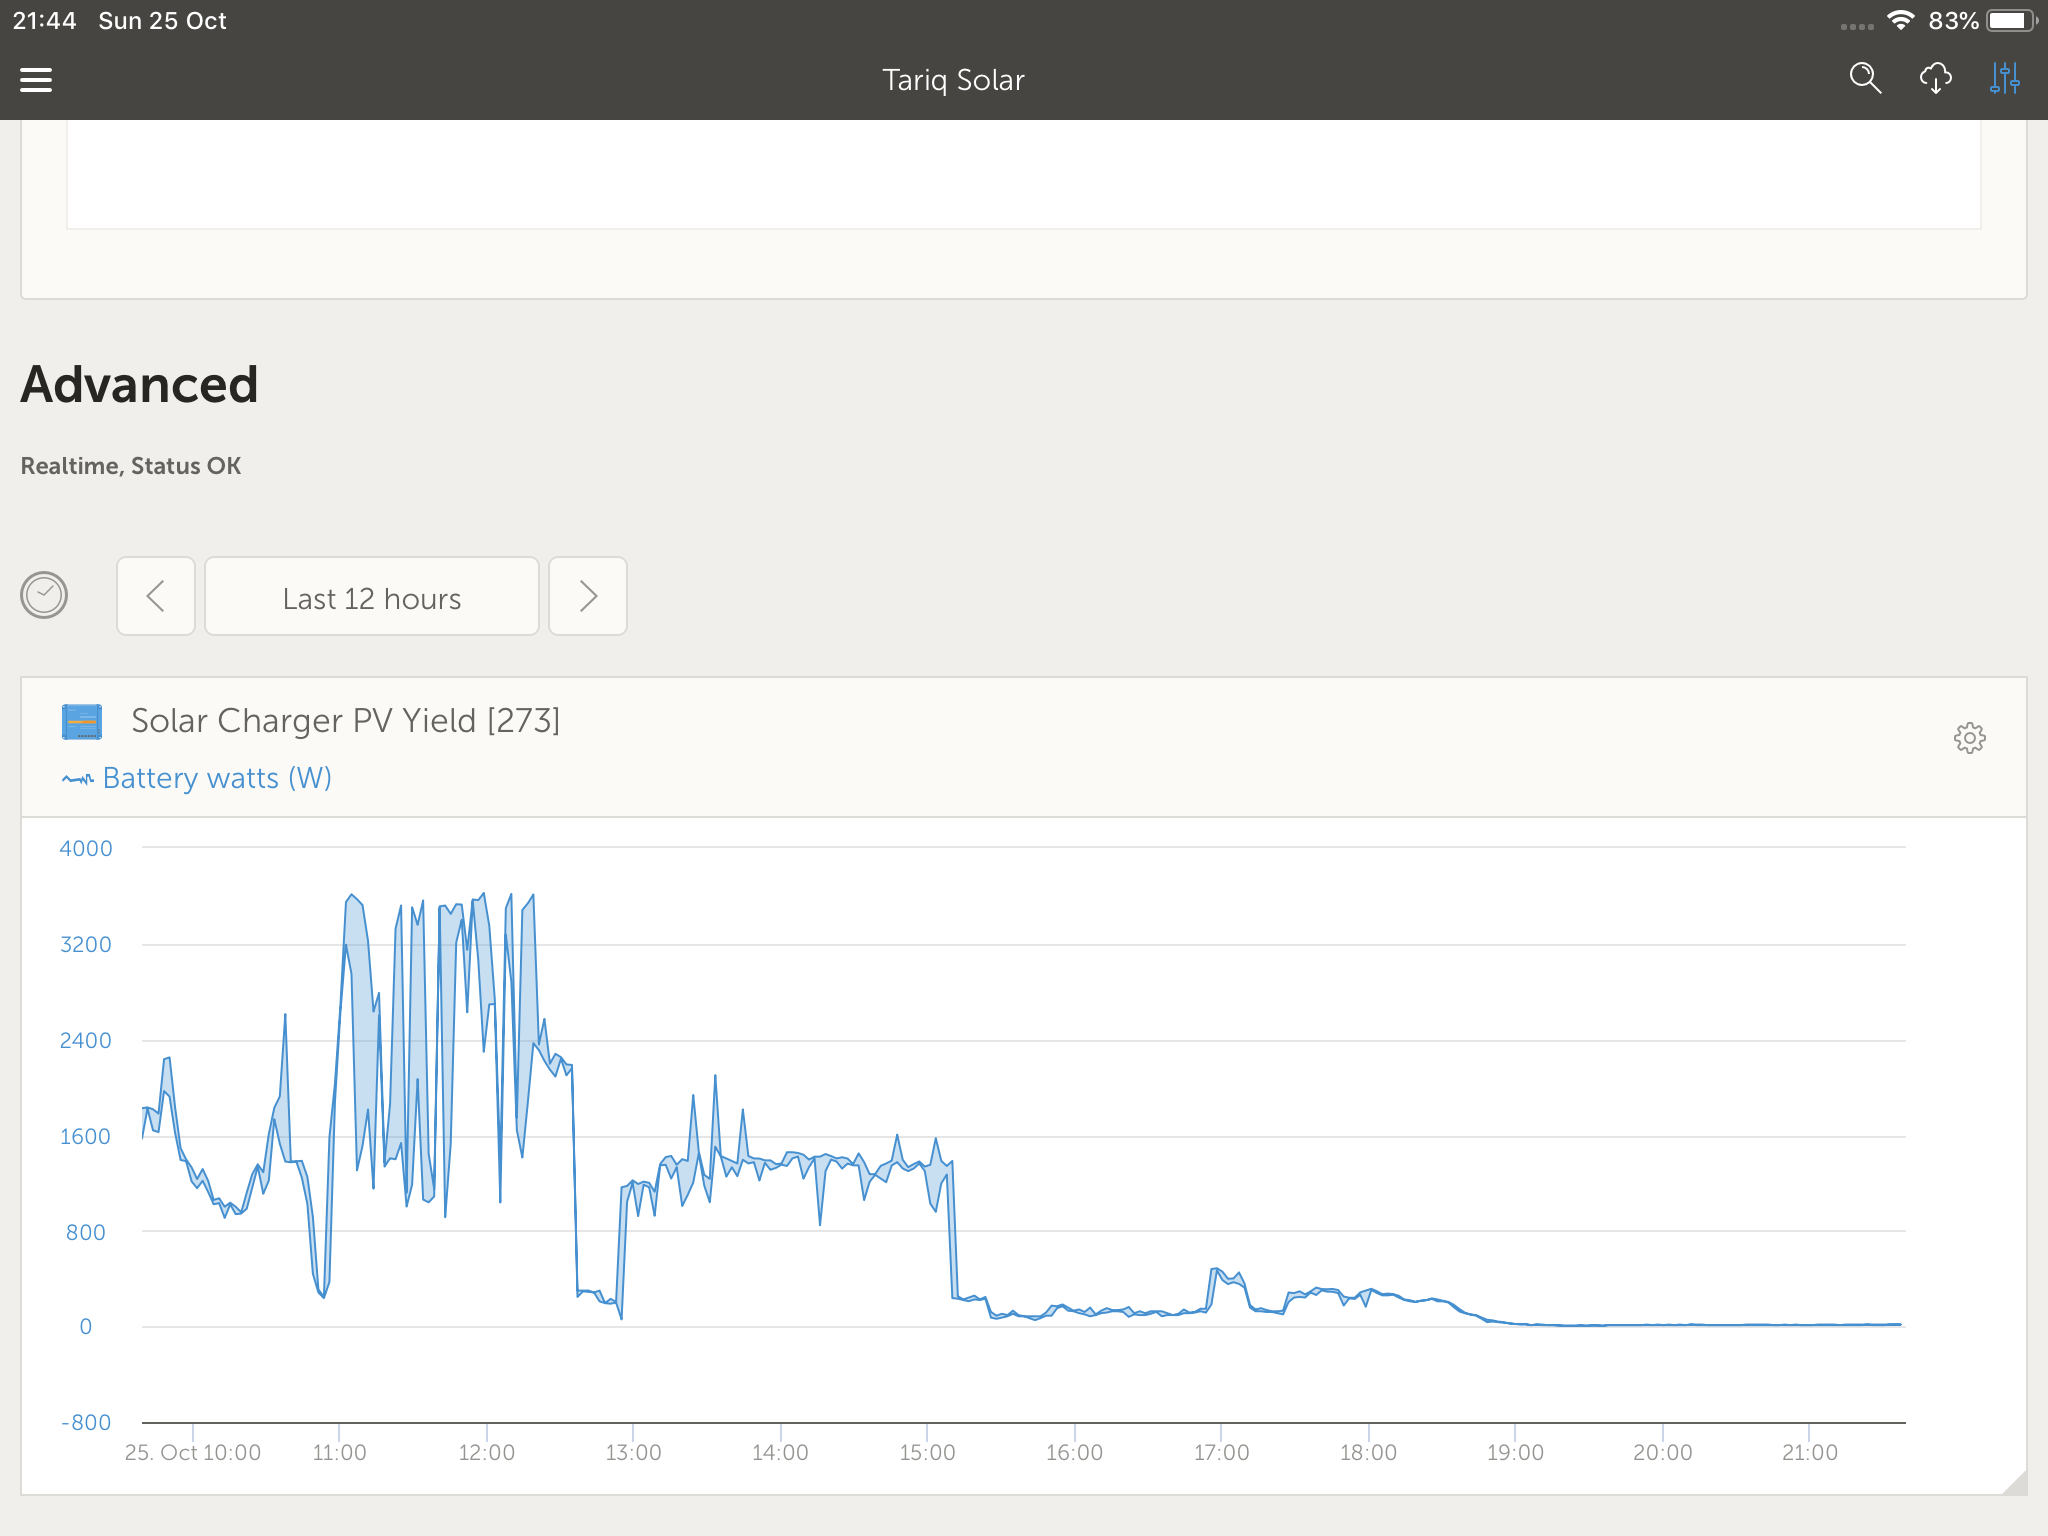
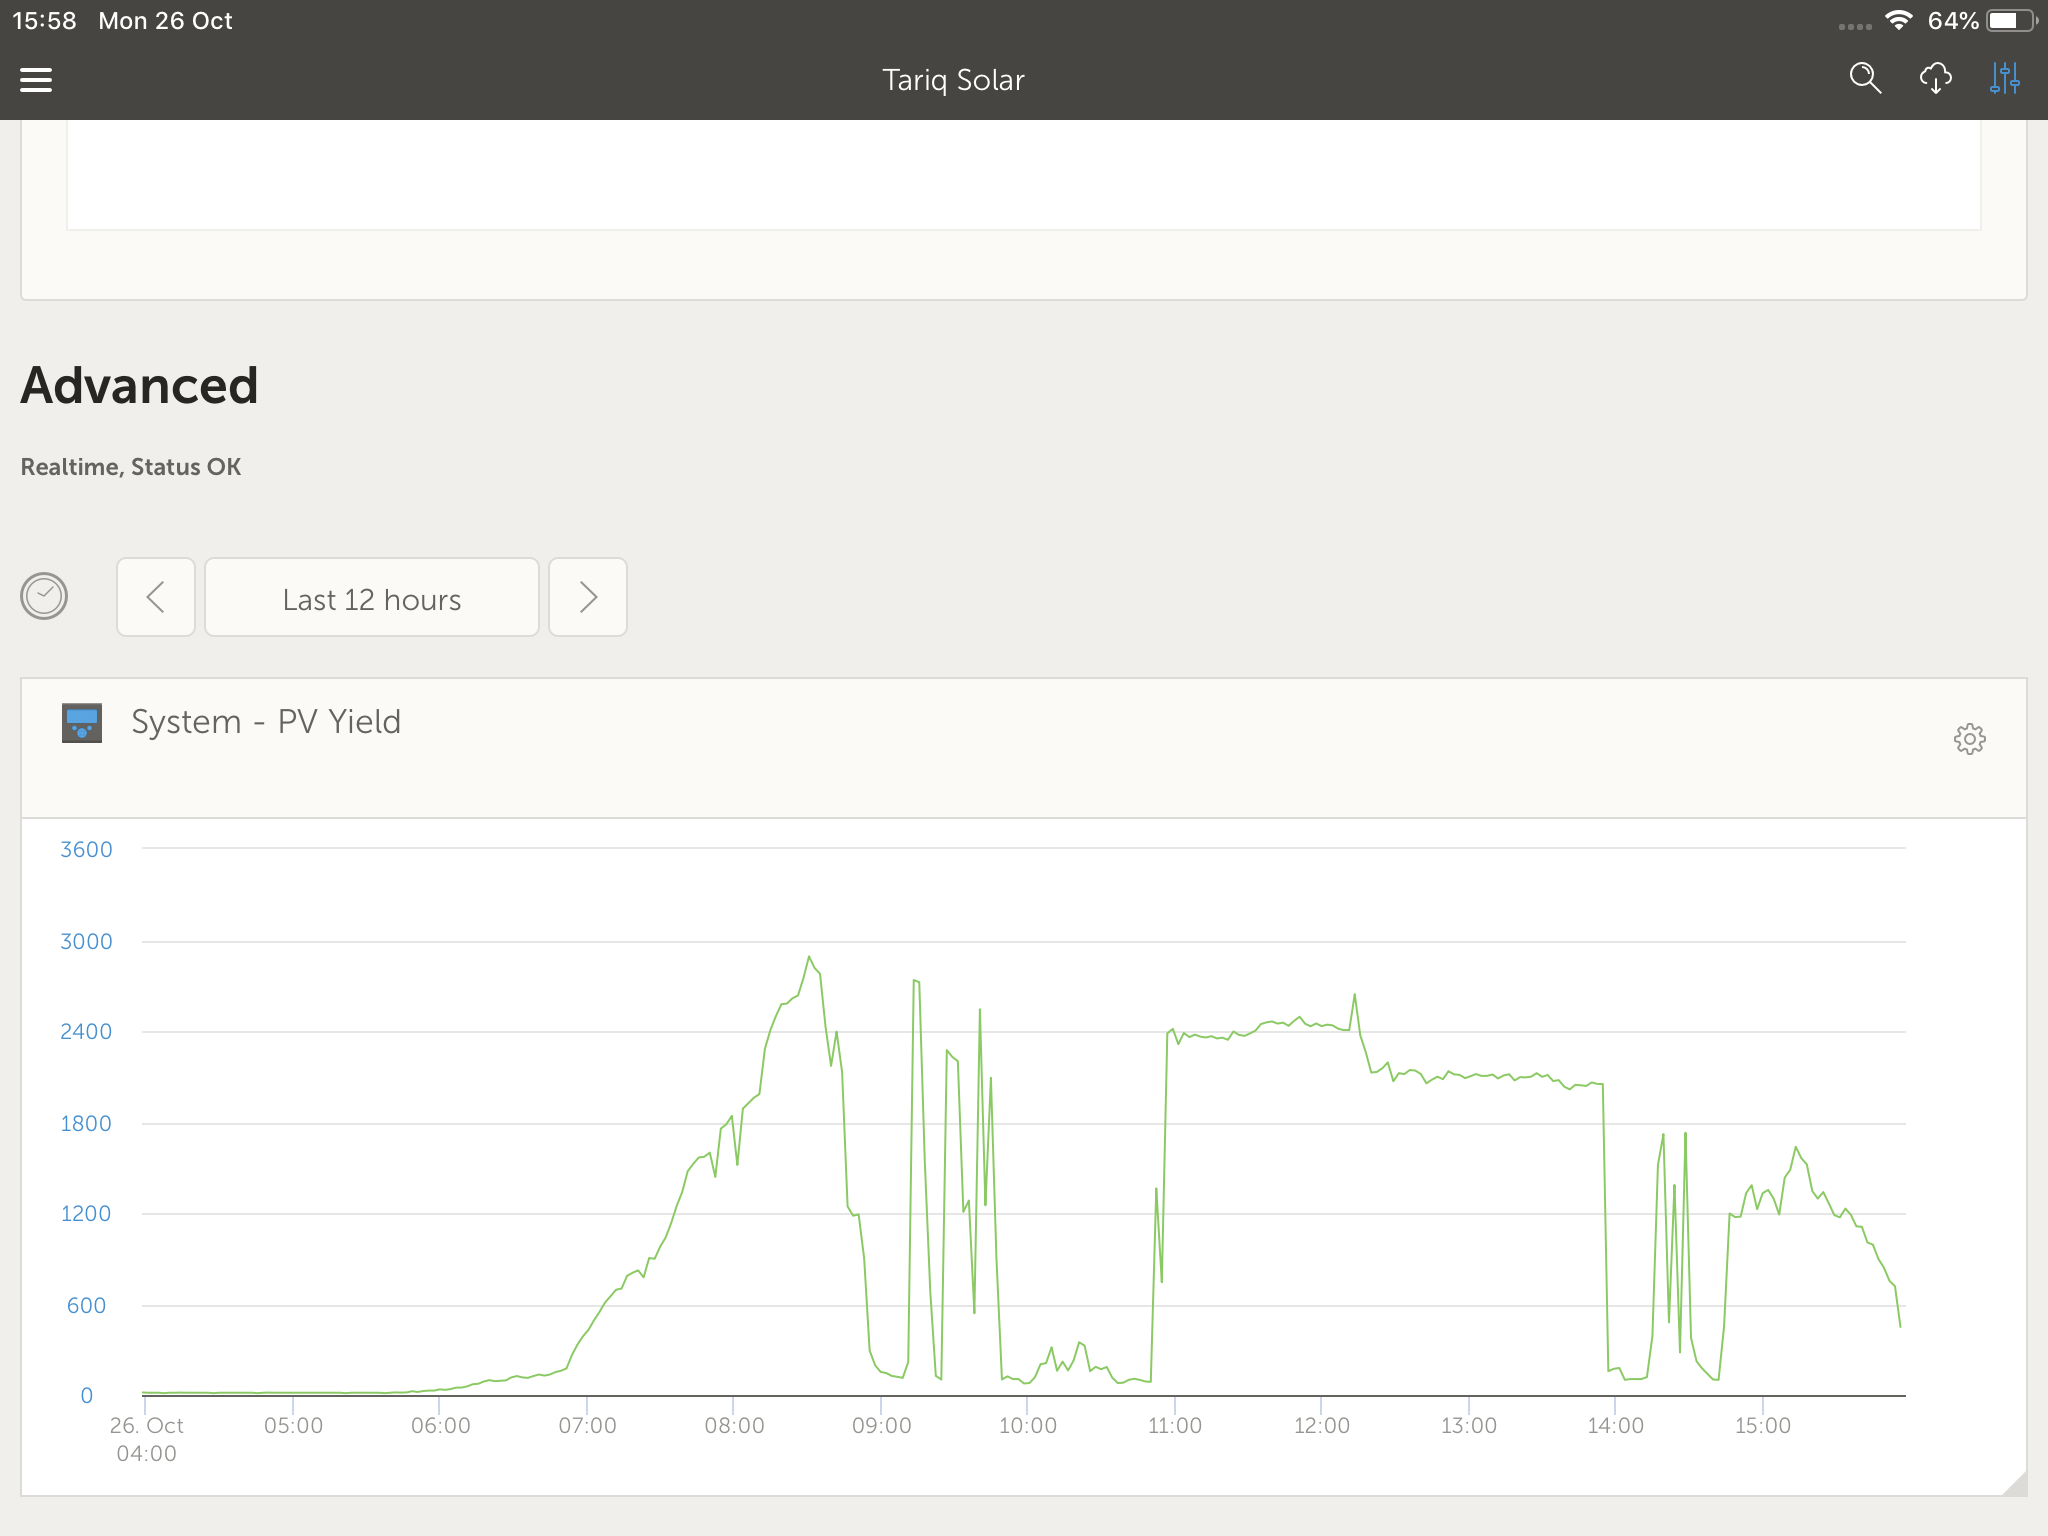
Hi Jaco, actually it was a general question, as a graph of pv yield is a crazy zig zag pattern
Yes, the inverter/pv does behave erratically when under a 2.2 kWh load, but I am sure, like you said that Victron had already picked up a problem with the mppt
Interesting. Mine is very stable. This is last Wednesday. The drop off was just due to demand.
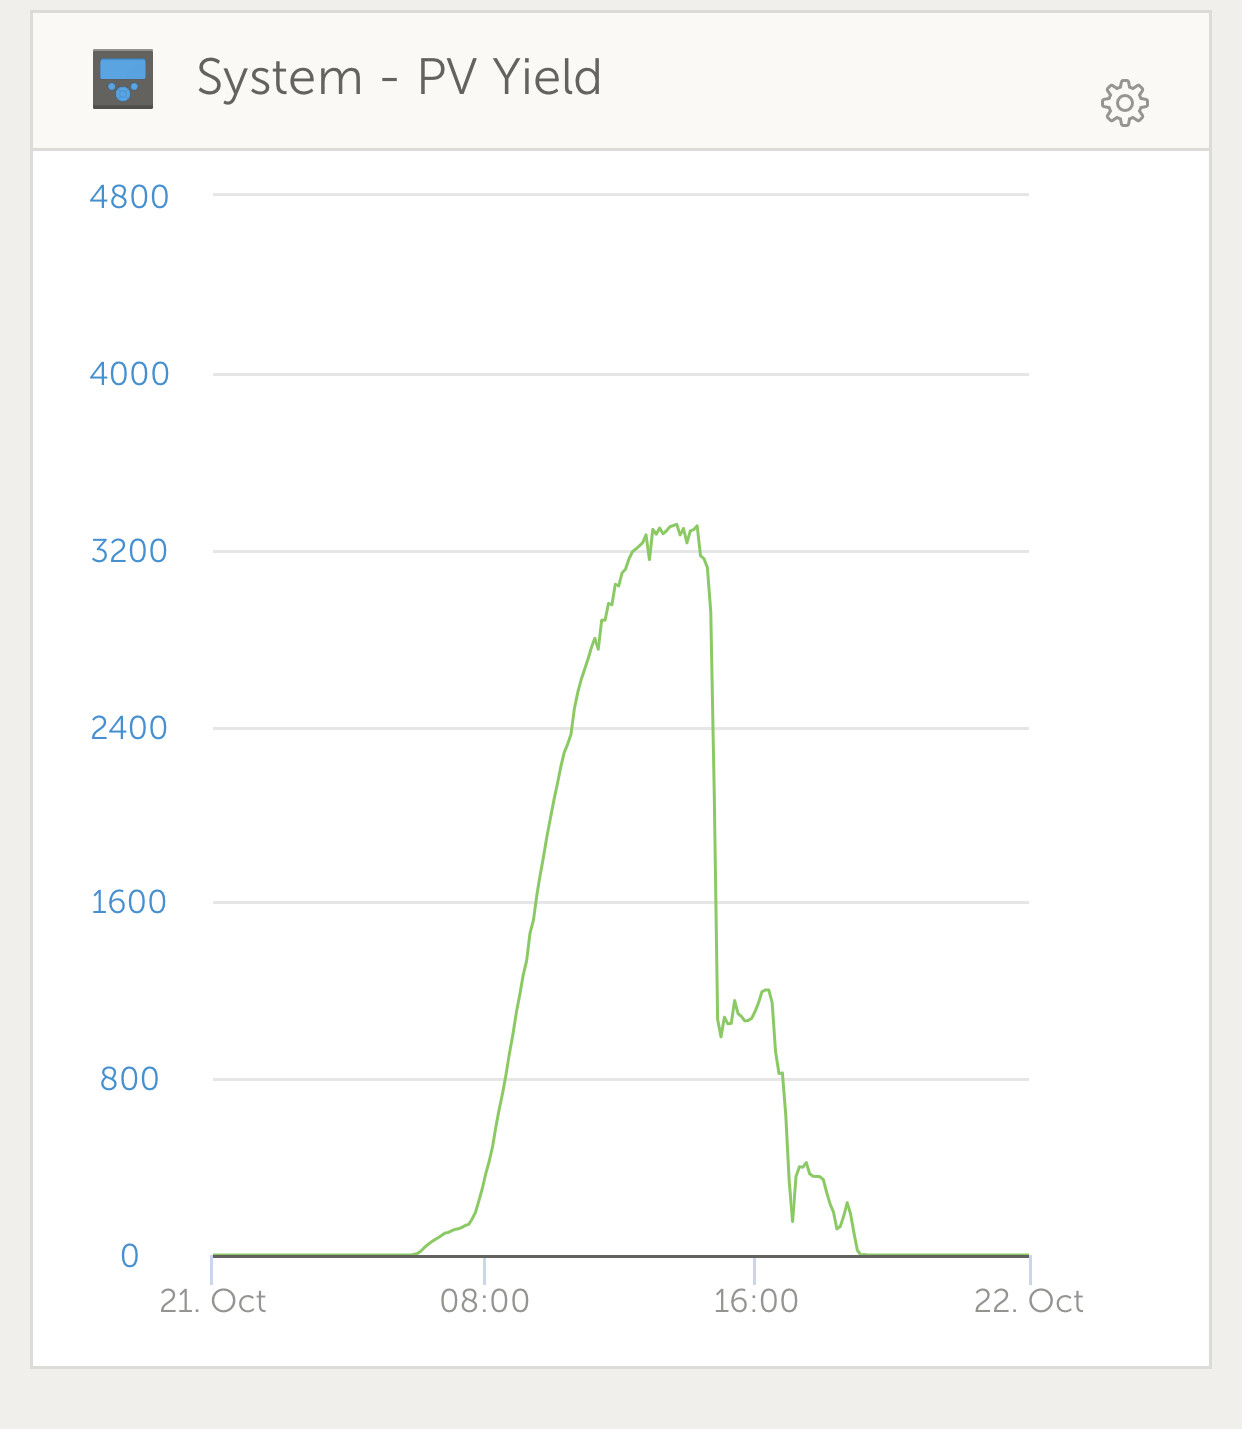
As you can see, mine is very smooth at least on the granularity shown on this snapshot of the data.
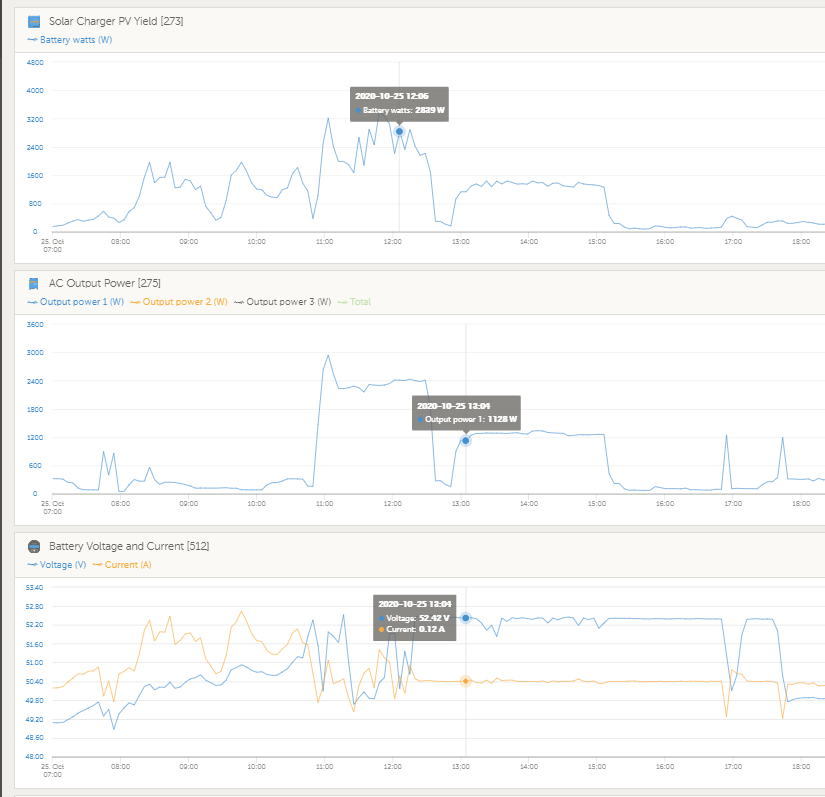
Maybe post also a graph of you battery watts. But it seems like your batteries is charged and now your load is intermittent. Remember the panels will only produce what you use.
1 Like
FYI New firmware available v1.53 for MPPT
Just updated mine was on v1.50
Hi Jaco, confess that I don’t really understand the graphs in depth, so is the zig zag anything to do with the mppt being faulty, or is is this normal operation…
As Victron is replacing the unit, not concerned, just wanted to know so I can learn
We’d need to see your battery graph, in order to see if it\s the MPPT being throttled.
Does look like it could be that though, as later in the day its more “stable” 1pm -3pm, and its not dropping below 800w during max production times - what are the loads in the day?
today as we speak, at noon time, bright sunny day, high cirrus clouds, the geyser is on, system drawing about 2.4 kWh, pv is supplying the full load, batteries are 100 %, and the pv production is rock solid, fluctuating by plus minus one percent only
That is normal of course. Today (in Cape Town area) there is some moisture in the air, there is the odd white wisp of a cloud. One would expect a little bit of fluctuation. Also remember that the MPPT is hunting all the time, going up a bit, going down a bit, trying to improve the yield, and this will also cause a slight fluctuation. We accept the “cost” of this hunting, because the alternative is so so much worse (as in literlly 30% worse) ![]()
1 Like
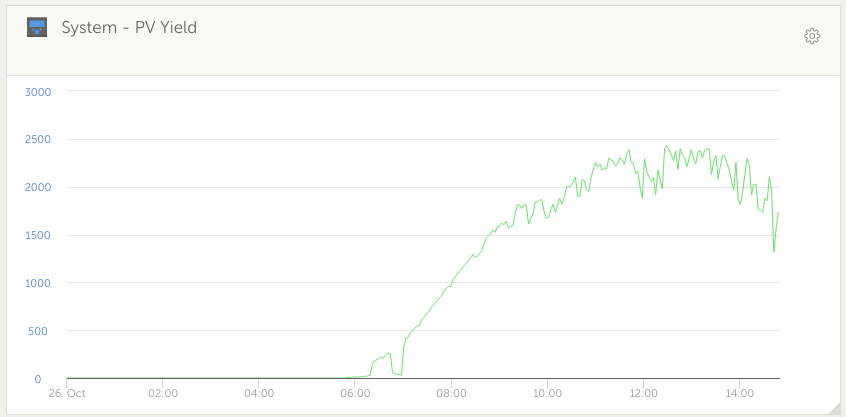
So here are two days, the one is some days ago when it was bright, cool and clear:

And this is today, with the moisture that’s hanging around that will allegedly bring some rain by Thursday…
Is the difference between yours and my graph, because you have a constant load ?? yours is a nice looking arc
I had lots of loads so the batteries were never full ![]()
Hi Tariqe
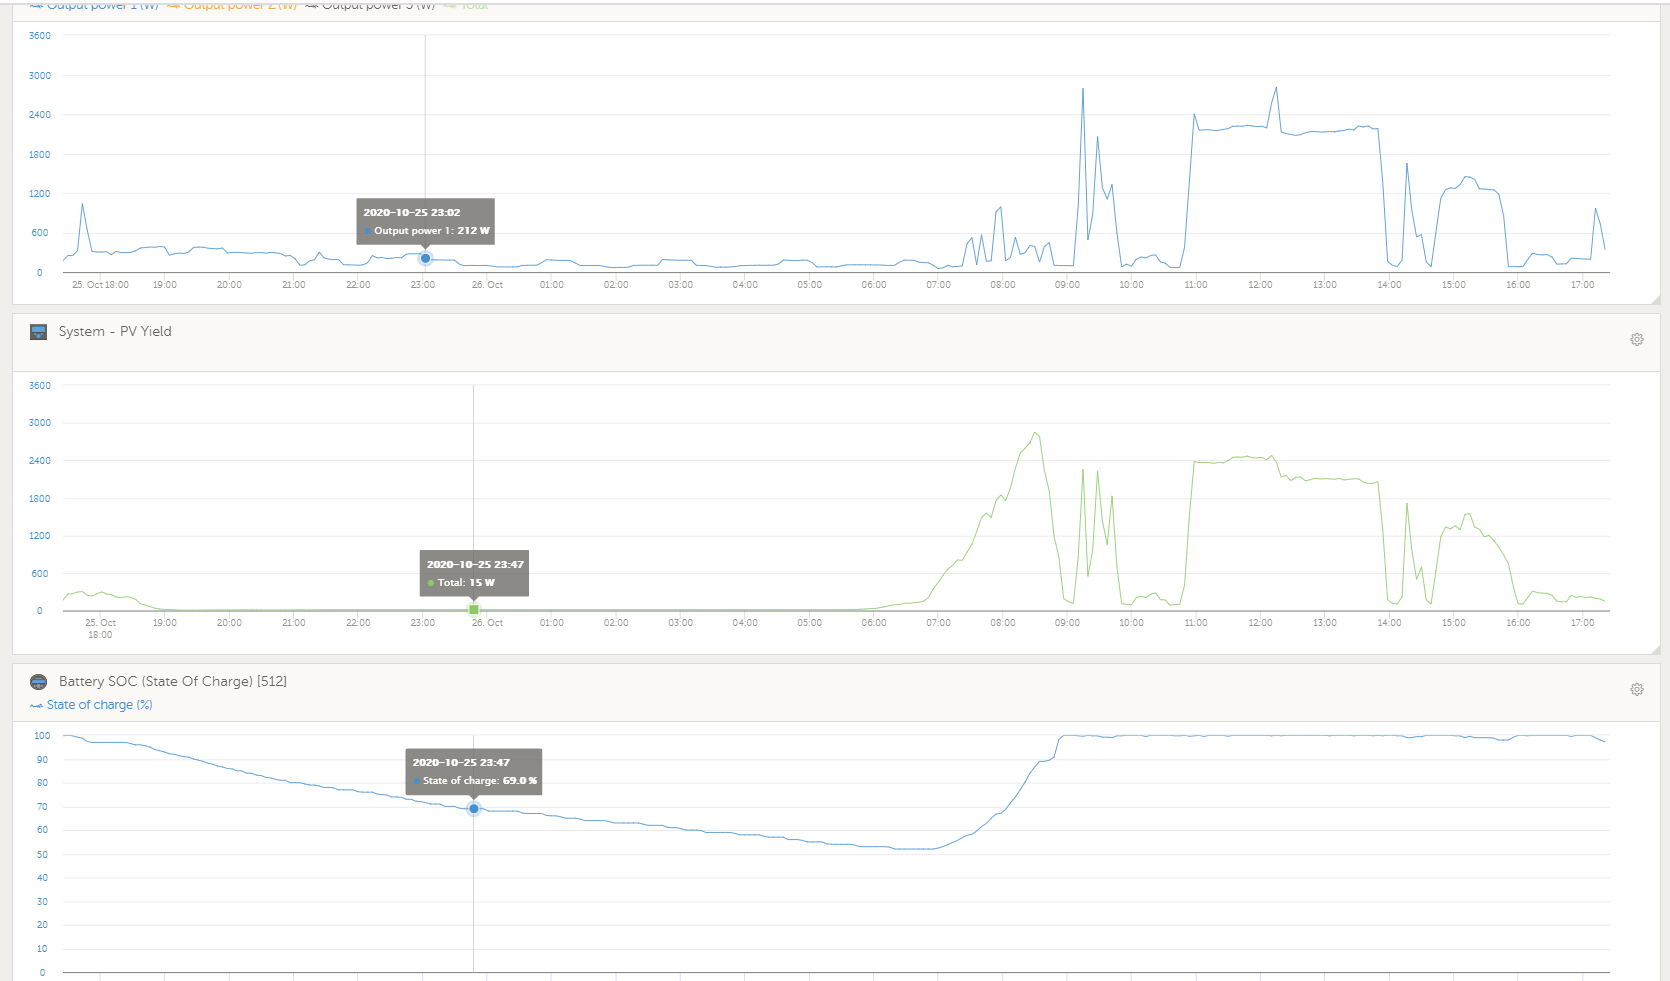
Your panels can only produce what is asked from them. In your case you have to look at the other graphs as well to understand what is happening to your PV production. Once the batteries are full, the load will determine the PV production. From what i see in your graphs for today, all seem okay and normal. See how the production follows the output power of the inverter.
1 Like
Hah, finally a light bulb has switched on in my little brain, thanks Jaco and Izak, never thought about the batteries
2 Likes
Thats why everyone and their dog asked you for the battery graphs!