how did you interface to the modbus interface ?
G
how did you interface to the modbus interface ?
G
Using this integration: GitHub - sfstar/hass-victron: Integration for Home Assistant to fetch data from the victron gx device via modbusTCP
let me ask different, did you connect a physical RS485 dev board to the RS485 port on the victron ?
assume RS485 connected to the HA ?
G
Sorry George - missed that part. I run a CerboGX and connect to the Cerbo Modbus using the integration above from a Home Assistant instance on a Pi. The above sensors are then available on the HA to use on the Energy Dashboard.
Let me stop there… that’s about as far as I can go without running out of knowledge… ![]()
You all know that Victron now has Forecasting and that you can get that data via the new Victron VRM API?
It was posted on this forum before.
Just wondering.
… actually found I previously deployed some code in NodeRed that does Modbus calls to the victron… so it’s been lying there, simply not used,
I’m changing my source from MQTT → Modbus.
G
did not know… but this is in victron. i want it inside HA.
G
https://vrm-api-docs.victronenergy.com/#/
Here you go:
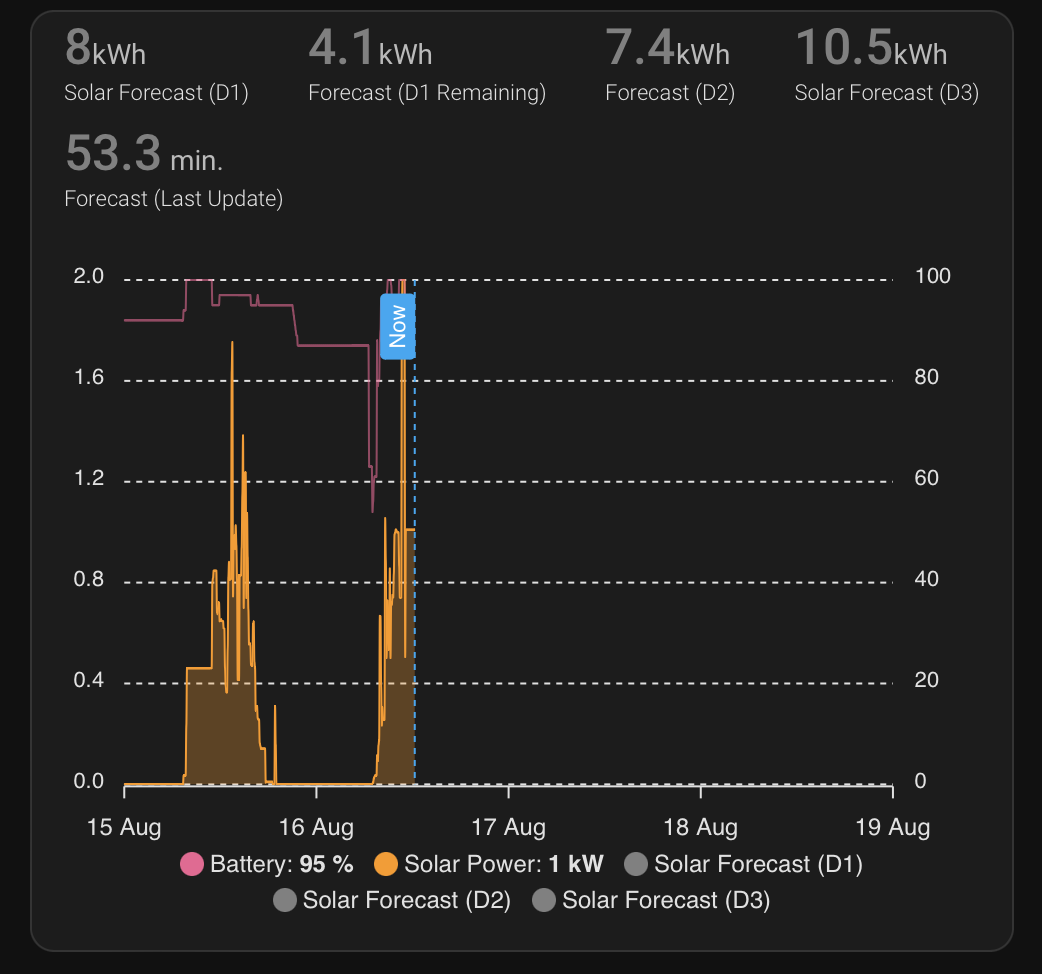
anyone have a idea why i’m not showing forecast day 2 etc.
I have Solcast installed
2nd question, how can I stretch the image to fill a page, I pasted code into a vertical stack card, alternate suggestion appreciated.
@Sc00bs - this is “copy” from your dashboard, porting it to fit into my Victron based system… about now where those generic naming of values would be loved ![]()
you also use a entity:
- entity: sensor.solcast_forecast_remaining_today_every_minute
This does not show in available entities for solcast ?
You need to update the apex code.
Should look something like this:
  - entity: sensor.forecast_today
    name: Solar Forecast (D1)
    extend_to: false
    color: grey
    opacity: 0.3
    stroke_width: 0
    yaxis_id: kWh
    show:
      legend_value: false
      in_header: false
    data_generator: |
      var today = entity.attributes.detailedForecast.map((start, index) => {
        return [new Date(start["period_start"]).getTime(), entity.attributes.detailedForecast[index]["pv_estimate"]*2];
      });
      var data = today
      return data;
Emphasis on: var today = entity.attributes.detailedForecast.map((start, index) => {
You probably not having detailedForecast in there.
if you don’t mind,
type: custom:apexcharts-card
view_layout:
  grid-area: solar
header:
  show: true
  standard_format: true
  show_states: true
  colorize_states: true
apex_config:
  chart:
    height: 250px
  tooltip:
    enabled: true
    shared: true
    followCursor: true
graph_span: 4d
now:
  show: true
  label: Now
span:
  start: day
  offset: '-1day'
all_series_config:
  type: area
  opacity: 0.3
  stroke_width: 1
series:
  - entity: sensor.soc
    name: Battery
    float_precision: 0
    type: line
    color: '#f06292'
    opacity: 0.6
    yaxis_id: capacity
    extend_to: now
    show:
      legend_value: true
      in_header: false
    group_by:
      func: last
      duration: 5m
  - entity: sensor.solar_yield
    name: Solar Power
    float_precision: 3
    color: '#ff9800'
    yaxis_id: kWh
    unit: kW
    transform: return x/1000;
    extend_to: now
    show:
      legend_value: true
      in_header: false
    group_by:
      func: avg
      duration: 5m
  - entity: sensor.peak_forecast_today
    name: Solar Forecast (D1)
    extend_to: false
    color: grey
    opacity: 0.3
    stroke_width: 0
    yaxis_id: kWh
    show:
      legend_value: false
      in_header: false
    data_generator: |
      return entity.attributes.forecast.map((entry) => {
            return [new Date(entry.period_start), entry.pv_estimate];
          });
  - entity: sensor.peak_forecast_tomorrow
    name: Solar Forecast (D2)
    float_precision: 3
    extend_to: false
    color: grey
    opacity: 0.3
    stroke_width: 0
    yaxis_id: kWh
    show:
      legend_value: false
      in_header: false
    data_generator: |
      return entity.attributes.forecast.map((entry) => {
            return [new Date(entry.period_start), entry.pv_estimate];
          });
  - entity: sensor.forecast_d3
    name: Solar Forecast (D3)
    float_precision: 3
    extend_to: false
    color: grey
    opacity: 0.3
    stroke_width: 0
    yaxis_id: kWh
    show:
      legend_value: false
      in_header: false
    data_generator: |
      return entity.attributes.forecast.map((entry) => {
            return [new Date(entry.period_start), entry.pv_estimate];
          });
  - entity: sensor.forecast_today
    yaxis_id: header_only
    name: Solar Forecast (D1)
    color: grey
    show:
      legend_value: true
      in_header: true
      in_chart: false
    data_generator: |
      var today = entity.attributes.detailedForecast.map((start, index) => {
        return [new Date(start["period_start"]).getTime(), entity.attributes.detailedForecast[index]["pv_estimate"]*2];
      });
      var data = today
      return data;
  - entity: sensor.forecast_remaining_today
    yaxis_id: header_only
    name: Forecast (D1 Remaining)
    color: grey
    show:
      legend_value: true
      in_header: true
      in_chart: false
    data_generator: |
      var today = entity.attributes.detailedForecast.map((start, index) => {
        return [new Date(start["period_start"]).getTime(), entity.attributes.detailedForecast[index]["pv_estimate"]*2];
      });
      var data = today
      return data;
  - entity: sensor.forecast_tomorrow
    yaxis_id: header_only
    name: Forecast (D2)
    color: grey
    show:
      legend_value: true
      in_header: true
      in_chart: false
  - entity: sensor.forecast_d3
    yaxis_id: header_only
    name: Solar Forecast (D3)
    color: grey
    show:
      legend_value: true
      in_header: true
      in_chart: false
  - entity: sensor.api_last_polled
    yaxis_id: header_only
    name: Forecast (Last Update)
    color: grey
    unit: ' min.'
    transform: return ((Date.now()) - (new Date(x).getTime())) / 60 / 60 / 24
    show:
      legend_value: true
      in_header: true
      in_chart: false
yaxis:
  - id: capacity
    show: true
    opposite: true
    decimals: 0
    max: 100
    min: 0
    apex_config:
      tickAmount: 5
  - id: kWh
    show: true
    min: 0
    apex_config:
      tickAmount: 5
  - id: header_only
    show: false
So you see you have a couple of different lines reading:
    data_generator: |
      return entity.attributes.forecast.map((entry) => {
            return [new Date(entry.period_start), entry.pv_estimate];
          });
That needs to change to
     var today = entity.attributes.detailedForecast.map((start, index) => {
        return [new Date(start["period_start"]).getTime(), entity.attributes.detailedForecast[index]["pv_estimate"]*2];
      });
      return today;
Or you can do this (not tested by me):
    data_generator: |
      return entity.attributes.detailedForecast.map((entry) => {
            return [new Date(entry.period_start), entry.pv_estimate*2];
          });
You need to do the change for each one.
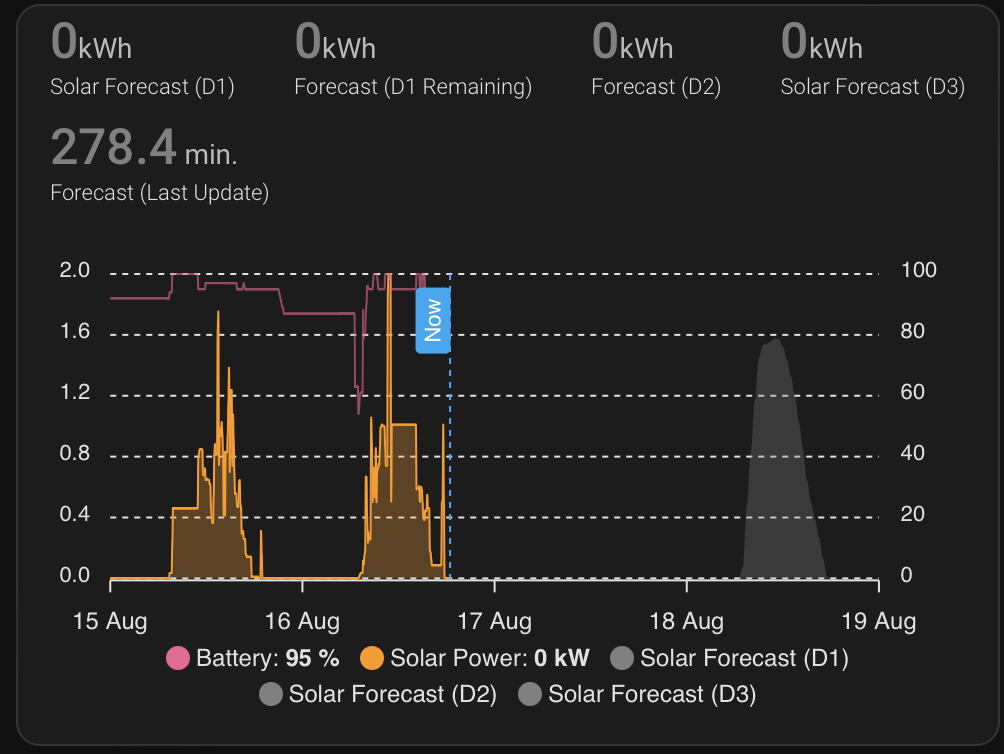
changed to:
resulting in:
type: vertical-stack
cards:
  - type: custom:apexcharts-card
    view_layout:
      grid-area: solar
    header:
      show: true
      standard_format: true
      show_states: true
      colorize_states: true
    apex_config:
      chart:
        height: 250px
      tooltip:
        enabled: true
        shared: true
        followCursor: true
    graph_span: 4d
    now:
      show: true
      label: Now
    span:
      start: day
      offset: '-1day'
    all_series_config:
      type: area
      opacity: 0.3
      stroke_width: 1
    series:
      - entity: sensor.soc
        name: Battery
        float_precision: 0
        type: line
        color: '#f06292'
        opacity: 0.6
        yaxis_id: capacity
        extend_to: now
        show:
          legend_value: true
          in_header: false
        group_by:
          func: last
          duration: 5m
      - entity: sensor.solar_yield
        name: Solar Power
        float_precision: 3
        color: '#ff9800'
        yaxis_id: kWh
        unit: kW
        transform: return x/1000;
        extend_to: now
        show:
          legend_value: true
          in_header: false
        group_by:
          func: avg
          duration: 5m
      - entity: sensor.peak_forecast_today
        name: Solar Forecast (D1)
        extend_to: false
        color: grey
        opacity: 0.3
        stroke_width: 0
        yaxis_id: kWh
        show:
          legend_value: false
          in_header: false
        data_generator: |
          var today = entity.attributes.detailedForecast.map((start, index) => {
            return [new Date(start["period_start"]).getTime(), entity.attributes.detailedForecast[index]["pv_estimate"]*2];
          });
          return today;
      - entity: sensor.peak_forecast_tomorrow
        name: Solar Forecast (D2)
        float_precision: 3
        extend_to: false
        color: grey
        opacity: 0.3
        stroke_width: 0
        yaxis_id: kWh
        show:
          legend_value: false
          in_header: false
        data_generator: |
          var today = entity.attributes.detailedForecast.map((start, index) => {
            return [new Date(start["period_start"]).getTime(), entity.attributes.detailedForecast[index]["pv_estimate"]*2];
          });
          return today;
      - entity: sensor.forecast_d3
        name: Solar Forecast (D3)
        float_precision: 3
        extend_to: false
        color: grey
        opacity: 0.3
        stroke_width: 0
        yaxis_id: kWh
        show:
          legend_value: false
          in_header: false
        data_generator: |
          var today = entity.attributes.detailedForecast.map((start, index) => {
            return [new Date(start["period_start"]).getTime(), entity.attributes.detailedForecast[index]["pv_estimate"]*2];
          });
          return today;
      - entity: sensor.forecast_today
        yaxis_id: header_only
        name: Solar Forecast (D1)
        color: grey
        show:
          legend_value: true
          in_header: true
          in_chart: false
        data_generator: |
          var today = entity.attributes.detailedForecast.map((start, index) => {
            return [new Date(start["period_start"]).getTime(), entity.attributes.detailedForecast[index]["pv_estimate"]*2];
          });
          return today;
      - entity: sensor.forecast_remaining_today
        yaxis_id: header_only
        name: Forecast (D1 Remaining)
        color: grey
        show:
          legend_value: true
          in_header: true
          in_chart: false
      - entity: sensor.forecast_tomorrow
        yaxis_id: header_only
        name: Forecast (D2)
        color: grey
        show:
          legend_value: true
          in_header: true
          in_chart: false
        data_generator: |
          var today = entity.attributes.detailedForecast.map((start, index) => {
            return [new Date(start["period_start"]).getTime(), entity.attributes.detailedForecast[index]["pv_estimate"]*2];
          });
          var data = today
          return data;
      - entity: sensor.forecast_d3
        yaxis_id: header_only
        name: Solar Forecast (D3)
        color: grey
        show:
          legend_value: true
          in_header: true
          in_chart: false
        data_generator: |
          var today = entity.attributes.detailedForecast.map((start, index) => {
            return [new Date(start["period_start"]).getTime(), entity.attributes.detailedForecast[index]["pv_estimate"]*2];
          });
          var data = today
          return data;
      - entity: sensor.api_last_polled
        yaxis_id: header_only
        name: Forecast (Last Update)
        color: grey
        unit: ' min.'
        transform: return ((Date.now()) - (new Date(x).getTime())) / 60 / 60 / 24
        show:
          legend_value: true
          in_header: true
          in_chart: false
    yaxis:
      - id: capacity
        show: true
        opposite: true
        decimals: 0
        max: 100
        min: 0
        apex_config:
          tickAmount: 5
      - id: kWh
        show: true
        min: 0
        apex_config:
          tickAmount: 5
      - id: header_only
        show: false
  - type: custom:apexcharts-card
    header:
      show: true
      title: PV Potential (Today)
      show_states: true
      colorize_states: true
    graph_span: 12h
    span:
      start: day
      offset: +6h
    series:
      - entity: sensor.tinman_east
        name: PV East
        float_precision: 0
        type: line
        color: '#f06210'
        opacity: 0.6
        yaxis_id: capacity
        extend_to: now
        show:
          legend_value: true
          in_header: false
      - entity: sensor.tinman_north
        name: PV North
        float_precision: 0
        type: line
        color: '#f06292'
        opacity: 0.6
        yaxis_id: capacity
        extend_to: now
        show:
          legend_value: true
          in_header: false