Dankie vir die thread @Sarel.Wagner - Kan dit wys vir al my bure wat nou oor my skouers loer en wil weet wat en hoe ek dinge doen.
Dis n plesier, ek is bly dit dien darem n doel, dankie!
Groetnis
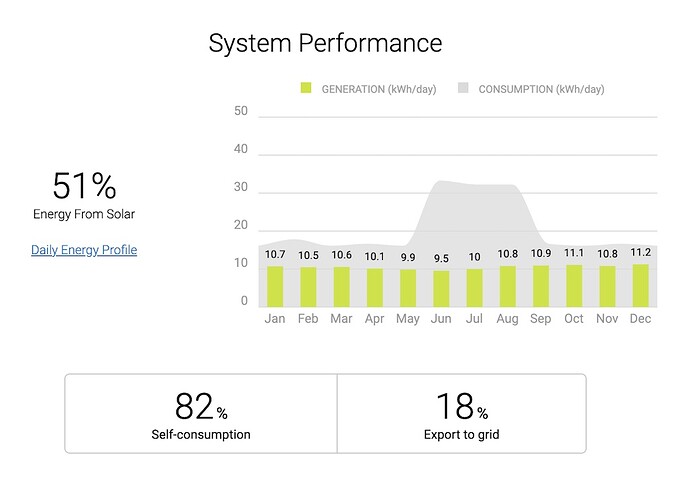
Before I even get to tweaking the system, I want to compare my designed modelling response to the actual response.
In post #3 here I showed the following model:
This shows the general modelled response of my system before I optimised the panels and how they were installed. I am at 28degrees so the general rule is to install them panels at 28 degrees.
The issue with that is firstly my panels cannot move so that will skew the generation for max yield for the year. Nothing wrong with that, it gives out max energy over the year.
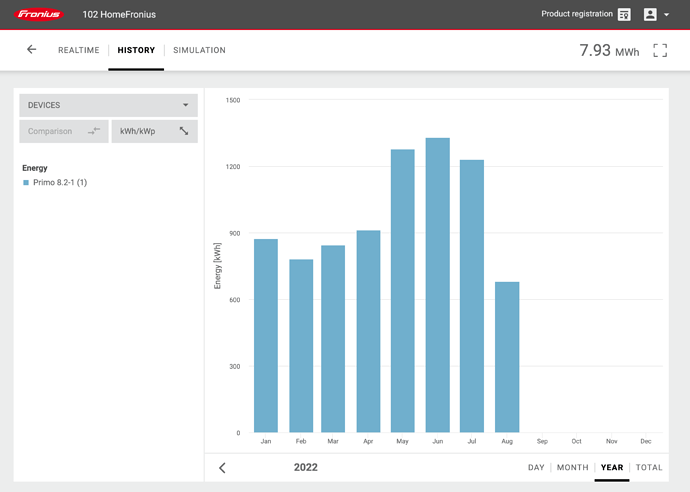
For my needs however, I wanted to skew the energy generation for max yield in Winter, as this is when I use the most energy for heating. So I change my panel angle to 33 degrees tilt to achieve this. below is the resultant data.
This is my 2 main strings on the Fronius. I have a third string on the MPPT but its performance mirrors this as its angle is the same.
Goal achieved.
Groetnis
So wanneer het jy die verstelling aan die panele gedoen? Mei soos die grafiek wys?
No, they were installed like that from day1. The graph just shows the effect of the tilt on production.
Groetnis
wow thanks @Sarel.Wagner , make a youtube channel and get paid for all this IP or write a book for SA

