Hold thumbs.
Eskom estimated the output of “rooftop solar” by comparing the demand for electricity at a substation level on days when there was high cloud cover, to the demand when there was low cloud cover, when all other logical variables were the same.
It estimated that a maximum of 4 411.50 megawatts of electricity was generated by solar panels in South Africa that were not contracted to it. In March 2022, the maximum solar output was only 983.1 megawatts.
This is an almost 350% increase in the maximum output of solar not contracted to Eskom over a period of 16 months, which shows the rapid uptake of solar by households and businesses in South Africa.
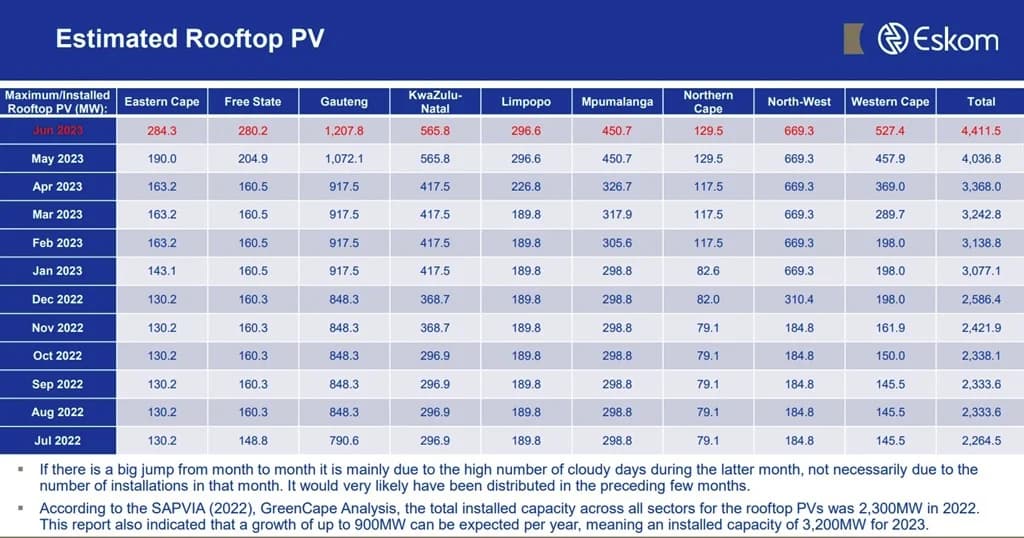
So does this tally with the amount of registered grid tie installations? ![]()
Eskom estimated the output of “rooftop solar” by comparing the demand for electricity at a substation level on days when there was high cloud cover, to the demand when there was low cloud cover, when all other logical variables were the same.
Considering this is an actual generation measurement, which will be a lot less than installed panels (ideal PV generation) this represents a very impressive amount of installed PV.
Mantashe again …
Then one reads this …
Eskom launching a distribution energy trader (it’s big)
On Monday, 21 August, I am going to Megawatt Park (Eskom’s HQ) for the launch of the energy trading company. Our host is Monde Bala, Eskom’s executive for distribution. This is big. Last week, we reported that energy regulator Nersa has granted the first part of a licence to Eskom’s national transmission company.
Next week, it launches the distribution energy trading company. The energy monopoly is being shifted – slowly, painfully and with ideological opposition every step of the way. This week, Public Enterprises Minister Pravin Gordhan and his own party’s Youth League were in a war of words because the young guns think he is selling off the family silver. That’s not true. Eskom is being restructured into its generation, transmission and distribution divisions to allow greater competition in the energy market. This is good news, but only if civil society ensures it brings down the price of electricity, especially for our poorest compatriots, and if it completes the journey to electrification for the South Africans who do not have power.
But as Marianne Merten reports here, a crucial piece of electricity legislation to change how energy is managed in South Africa, is stuck in Parliament, courtesy of you know which Cabinet Minister.
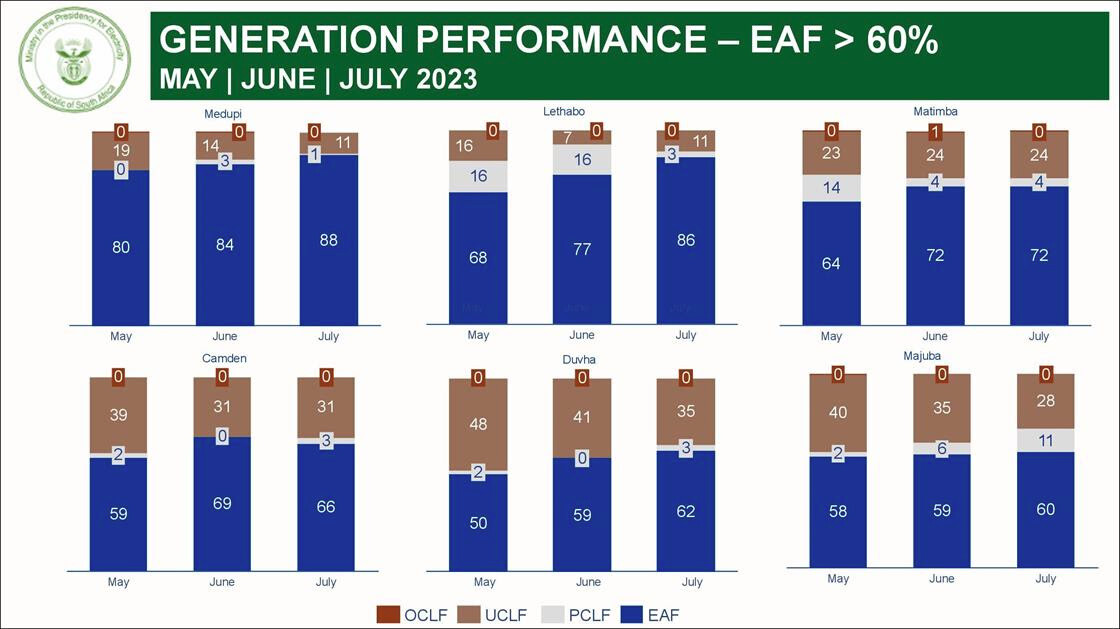
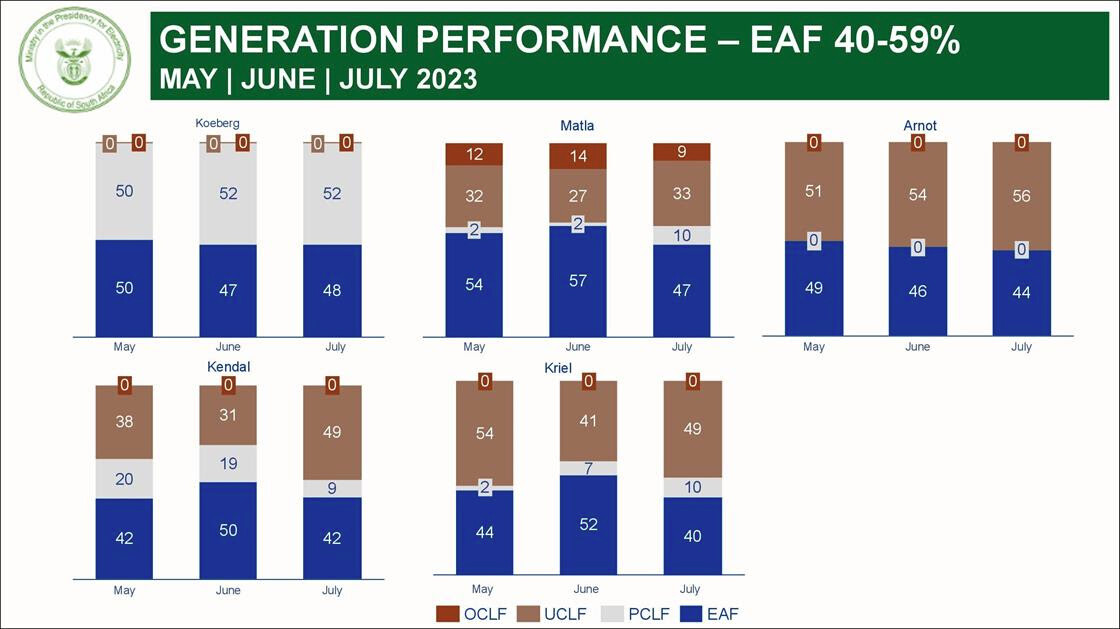
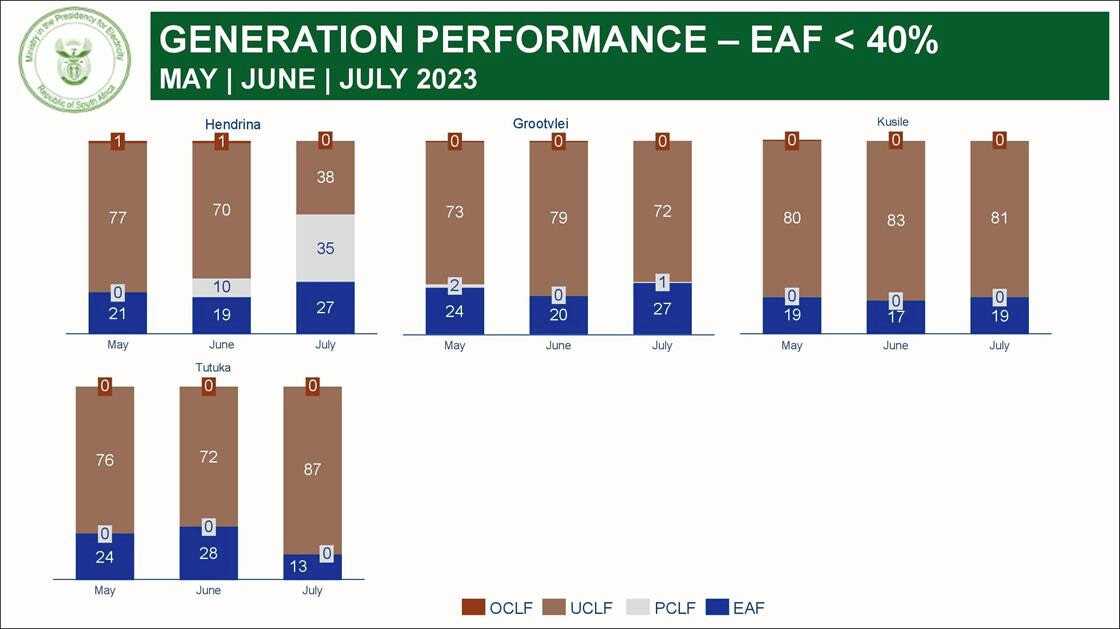
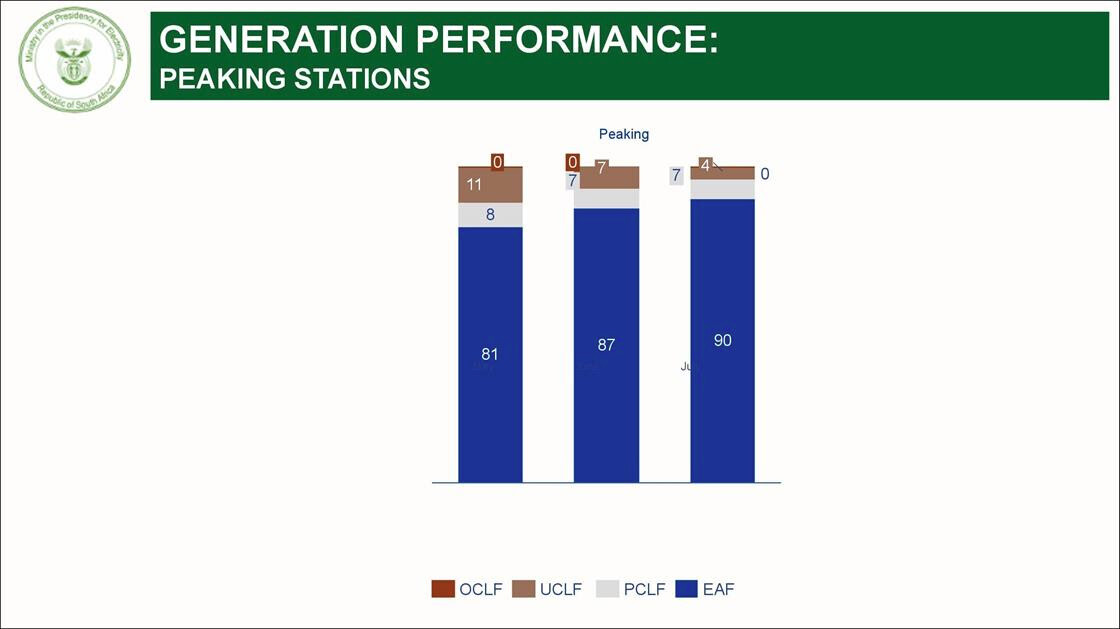
The best and worst performing power stations
At the weekend energy briefing, Electricity Minister Kgosientsho Ramokgopa showed a report card of each coal-fired power station’s performance (scroll below for graphs). If you look carefully, you’ll see how hard the fossil-fuel powered fleet is being run to keep the lights on. The bar to focus on is the blue one showing the energy availability factor (EAF). The charts show how close to the end of life many of these power stations are.
Ramokgopa’s strategy is to run them hard, delay the decommissioning of the oldest power stations, and hope and pray that the new generating capacity (from wind, solar, gas and perhaps Karpowerships) is transmitted on time to end load shedding well ahead of the 2024 election.
The ANC’s electoral chances ride in tandem with load shedding: an inverse proportion applies, according to regular polling. The governing party’s fortunes rise and fall with the intensity of rolling blackouts due to power cuts. Julia Evans reported here on how much you pay for diesel to fire the open-cycle gas turbines that prevent a national blackout.
Add some links to the info please @TTT - I like the dashboard and need to use it for something else ![]()
Got it from Ferial Haffajee’s “What the F#*K?” email she sent.
No links, just the email

Man… you can cut the irony with knife…
It was alluded to now and then that I have “this issue” with LS levels and clever slipping in of levels, the schedules, the total hours off in 36h, and all that I questioned. Some took the time to re-explain to me, over and over, how LS works ![]()
Yeah, seems I was not the only one seeing something was simply just not right …
… and now they have 16 levels to “make it look better”.
New load-shedding rules
The National Energy Regulator of South Africa (Nersa) has published a consultation document detailing a revised load-shedding approach that allows for up to Stage 16 power cuts.
The new document is known as the third edition of the NRS 048-9 Electricity Supply – Quality of Supply: Code of Practice.
It provides load reduction practices, system restoration practices, and critical load and essential load requirements under system emergencies.
After finishing all consultation processes, the document will be reworked as the NRS 048-9 Code of Practice Edition 3.
It will then replace the current Edition 2 standing code that Eskom’s System Operator uses to define load-shedding stages.
Padayachee explained that they came up with an innovative, simple, and less confusing way to govern load-shedding.
The new regime means that 5% of electricity demand is reduced for each stage of load-shedding. Stage 1 reduces 5% of demand, Stage 2 reduces 10%, Stage 3 cuts 15%, and so forth.
The electricity demand is forecasted for every hour of the day using a formula described below, with sample values in brackets.
- Demand (25,000 MW) = Forecasted hourly demand (30,000 MW) + Reserve margin (2,500 MW) – Curtailment load (7,500 MW)
They will then divide the demand with supply, which will show a surplus, where no load-shedding is needed, or a shortfall, which requires load-shedding.
If the shortfall is between 0% and 5%, Stage 1 load-shedding will be introduced. If it is between 5% and 10%, Stage 2 will be implemented.
The new document accommodates up to Stage 16 load-shedding, which means demand exceeds supply by up to 80%.
The table below outlines the proposed reductions in load under each load-shedding stage for general and load curtailment customers.
Proposed demand reductions under NRS 048-9 Electricity Supply Edition 3
Load-shedding Stage Reduction through load-shedding Reduction through load curtailment
Proposed demand reductions under NRS 048-9 Electricity Supply Edition 3
Load-shedding Stage Reduction through load-shedding Reduction through load curtailment
Stage 1 5% of demand 10% reduction in normal demand profile
Stage 2 10% of demand 10% reduction in normal demand profile
Stage 3 15% of demand 15% reduction in normal demand profile
Stage 4 20% of demand 20% reduction in normal demand profile
Stage 5 25% of demand 30% reduction in normal demand profile
Stage 6 30% of demand 30% reduction in normal demand profile
Stage 7 35% of demand 40% reduction in normal demand profile
Stage 8 40% of demand 40% reduction in normal demand profile
Stage 9 45% of demand 50% reduction in normal demand profile
Stage 10 50% of demand 50% reduction in normal demand profile
Stage 11 55% of demand Reduction to essential loads or as instructed by System Operator
Stage 12 60% of demand Reduction to essential loads or as instructed by System Operator
Stage 13 65% of demand Reduction to essential loads or as instructed by System Operator
Stage 14 70% of demand Reduction to essential loads or as instructed by System Operator
Stage 15 75% of demand Reduction to essential loads or as instructed by System Operator
Stage 16 80% of demand Reduction to essential loads or as instructed by System Operator
yup, this wont be more confusing than ever for regular Joe.
Not Eskom but sh1tty infrastructure here, we been off, basically the area being served by this cable/transformer since Friday evening load shedding. And Tshwane/Pretoria is on strike… so no ETA or any info on what is wrong… So so glad for the Sun
SonnigeGroetnis
I think it is interesting that they are doing this now when Load Shedding is actually at lower levels. Probably for exactly the reason mentioned above… had they done this while we were at stage 6, you can bet your bottom dollar the collective “Broad Media” papers would have had a field day with it.
Eish ![]()
1 Like
And you were expecting? This was no surprise, at all…
ButjaGroetnis